3D Computer-Automated Threshold Amsler Grid Test
Purpose: Development and implementation of a computer-automated system for near threshold central visual field acquisition in establishing 3-D displays of (central) visual fields (hill-of-vision). The patient will indicate the visible perimeter of vision in a variety of contrast presentations. This will not only reveal relative as well as absolute scotomas but permit the calculation of the slope of the depression.
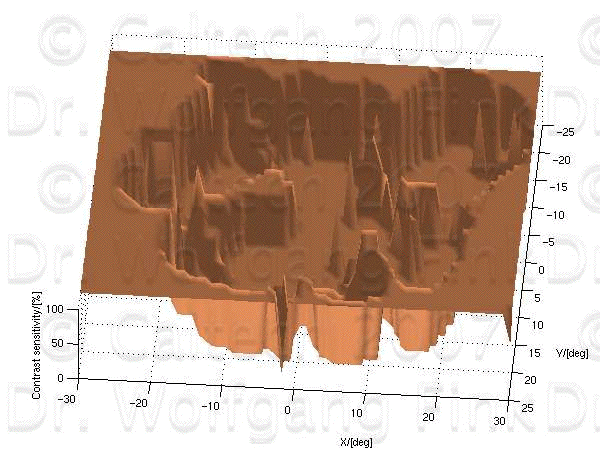
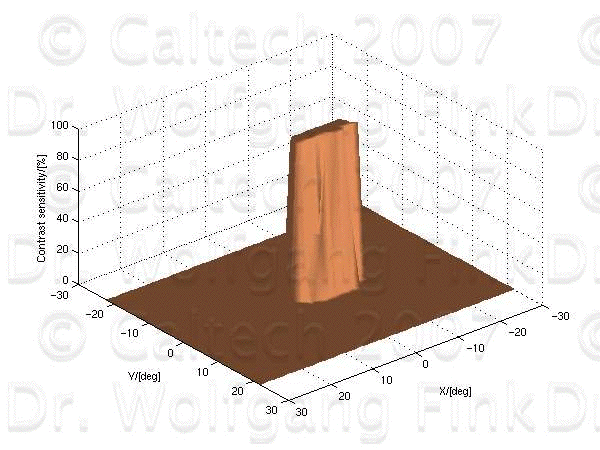
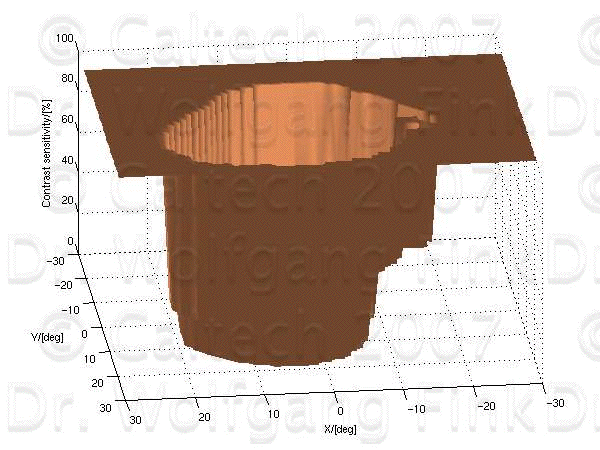
Methods: We have developed a computerized test program that displays an Amsler grid at a preselected greyscale level and preselected angular resolution on a computer screen at a fixed distance. The patient, with the Troxler effect suppressed centrally, is able to mark the areas on the Amsler grid that are missing from his field of vision. The same procedure is then repeated at various greyscale levels - simulating increasing degrees of contrast - and the respective results are recorded and later automatically displayed by the computerized test program. A total of approximately 4-5 minutes per eye is required. With these results, a 3-D depiction of the (central) visual field is obtained, describing the location, extent, slope, depth, and shape of the scotomas.
Conclusions: This new, completely computer-based test, offers a novel method for evaluating the central visual field with the additional parameter of depth. This test provides several advantages over conventional perimetry including: 1) additional information through 3-D rather than 2-D depiction of scotomas, 2) superior angular resolution, and 3) direct patient interaction with a computerized system in a much shorter examination time.
Optic Neuritis - Solid Shaded Depiction
Place your mouse over the image to see:
Optic Neuritis - Wire Frame Depiction
Anterior Ischemic Optic Neuropathy (AION) - Solid Shaded Depiction
Place your mouse over the image to see:
Anterior Ischemic Optic Neuropathy (AION) - Wire Frame Depiction
Glaucoma - Solid Shaded Depiction
Place your mouse over the image to see:
Glaucoma - Wire Frame Depiction
"Dry" Macular Degeneration - Solid Shaded Depiction
Place your mouse over the image to see:
"Dry" Macular Degeneration - Wire Frame Depiction
Method and Examination Procedure
The examination with our computerized test program should take place in a separate examination room with well-defined ambient brightness. After dark adaptation the patient will be positioned in front of the computer monitor at a fixed distance - determining the angle of the visual field - by means of both a chin- and head-rest. The eye not under examination will be totally covered with an eye-cover. If need be, a necessary refractive correction has to be applied by means of the patient's eye-glasses or contact lenses, or correction glasses. Our computerized test program then displays an Amsler grid at a preselected greyscale level and preselected angular resolution on the computer screen. The patient, with the Troxler effect suppressed centrally, is able to mark the areas on the Amsler grid that are missing from his field of vision. He does that by either circumscribing/outlining the missing areas (scotomas) directly on the touchscreen, by using a lightpen or similar pointing device. If necessary, a mouse or even the keyboard would work in lieu of a touchscreen. The same procedure is then repeated at various greyscale levels - simulating increasing degrees of contrast (contrast sensitivity levels) - and the respective results are recorded and later automatically displayed by the computerized test program. A total of approximately 4-5 minutes per eye is required. With these results, a 3-D depiction (hill-of-vision) of the (central) visual field is obtained, describing the location, extent, slope, depth, and shape of the scotomas.
Discussion
Conventional perimetry and even campimetry provides information pertaining to the borderline between seeing and non seeing areas. At most, in some forms of automated perimetry, a mean sensitivity to light within a scotoma is displayed. The present techniques, however, do not provide the extra information inherent in a region of visual depression that is available by our system: Our system displays the area of depression in X and Y axis (relative to visual fixation) but also, on the Z axis in regard to visual contrast sensitivity. Not only does 3-D information permit further distinctions between certain visual disorders (ARMD might cause an absolute scotoma while macular edema only produces a relative scotoma) but the 3-D shape of each visual depression has the potential for the development of a library of shapes and slopes that are likely to be signature patterns for various ophthalmological conditions. Our new, completely computer-based test, offers a novel method for evaluating the central visual field. This test provides several advantages over conventional perimetry including: additional information through 3-D (includes depth) rather than 2-D depiction of scotomas superior angular resolution direct patient interaction with a computerized system in a much shorter examination time use of regular computer equipment (no additional equipment necessary) distributability over the Internet interactive accessability over the Internet portability via laptop software package can easily be updated/modified.
This project was featured in:
Wolfgang Fink, Ph. D.
Senior Researcher at Jet Propulsion Laboratory (JPL)
Visiting Research Associate Professor of Ophthalmology at University of Southern California (USC)
Visiting Research Associate Professor of Neurosurgery at University of Southern California (USC)
Visiting Associate in Physics at California Institute of Technology (Caltech)
Mailing Address:
California Institute of Technology
Visual and Autonomous Exploration Systems Research Laboratory
15 Keith Spalding (corner of E. California Blvd & S. Wilson Ave)
Mail Code 103-33
Pasadena, CA 91125
USA
Phone: 1-626-395-4587
Fax: 1-626-395-4587
E-mail: wfink@autonomy.caltech.edu
Licensing Contact
Office of Technology Transfer at Caltech


